Bondsavvy, the leading provider of individual corporate bond recommendations for individual investors, calculates leverage
ratios to assess default risk and relative value of corporate bond investments. Leverage ratios tell us how much
debt a bond
issuer has relative to its cash flow, or EBITDA, which is a company’s earnings before interest, taxes, depreciation,
and amortization. As soon as we
calculate a company’s leverage ratio, we can compare the risks and potential returns for a variety of corporate bond
investments.
This article reviews the leverage ratio formula, its rationale, where to find the information investors need to
calculate leverage ratios, why a bond
issuer’s leverage ratio can be more important than its bond rating,
and how we use leverage ratios and other data points to make bond recommendations for Bondsavvy's subscribers. We
also discuss how leverage ratios
are included in financial covenants.
Leverage Ratios Are One of Many Important Investment Considerations
While very important, leverage ratios are one of many factors that make up the bond investment analysis we
present when recommending new corporate bonds. Watch this sample edition of The Bondcast to
see all of Bondsavvy’s investment considerations, which include the following:
Bond issuer level
- Revenue and EBITDA growth
- Upcoming debt maturities
- Capital allocation, or what a company does with the money it earns (stock buybacks, dividends, capex, debt
paydown, acquisitions)
- Leverage ratio and interest coverage ratio
- Cash balances relative to company debt
- Potential for credit ratings upgrades or downgrades
- Ranking of unsecured bonds relative to any senior debt in a company’s capital structure
- Financial covenant cushion
Bond level
Since most bond issuers have many bonds outstanding, we also need to evaluate a number of bond-level, or
CUSIP-level, considerations such as:
- How credit spreads and YTMs of a company’s
bonds compare to comparable
corporate bonds
- Trading activity reported to TRACE
- Magnitude and quality of live bid-offer quotes
- Any ‘term premium’ available, where yields of corporate bonds with a longer time to maturity have higher yields
than those due in the nearer term
Macro level
Lastly, we consider a number of macro factors, including:
- Trends and future potential movement of Treasury yields
- Performance of certain industry groups relative to others
- Level of industry concentration of currently recommended corporate bonds
As we will discuss later, we believe this level of fixed income analysis is superior to that of the bond rating
methodologies used by Moody's and S&P, which ignore a bond's price,
YTM, maturity date, and interest rate risk. Further, the way bond rating methodologies "misweigh" various factors
causes many bond ratings to be inaccurate
from a default risk perspective. Often times, bond rating agencies bestow investment-grade bond ratings on large,
global companies that have far
weaker financials than many smaller, nimbler high yield bond issuers.
More to come later in this article.
Leverage Ratio Formula
Leverage ratios tell bond investors the amount of debt a company has relative to its EBITDA. One company might have a
higher absolute level of debt
compared to another company; however, we need to compare a company’s debt balance to its EBITDA to see how well its
cash flow can support its debt.
As shown in Figure 1, the leverage ratio formula is a company’s total debt divided by its last twelve months’
EBITDA. All else equal, a company
with a high leverage ratio of 6x or 7x has a materially higher risk of default than a company with a low leverage
ratio of 1-2x.
Figure 1: Leverage Ratio Formula

We will now discuss each component of the leverage ratio formula and where to find each key piece of information.
Why Is EBITDA in a Leverage Ratio important?
Reason 1: Understanding a bond issuer's level of cash flow to service its debt
With the exception of lending institutions, which borrow money they lend customers to generate net interest income,
we use EBITDA as the primary metric
to assess a company’s earnings relative to its debt and interest expense. Most investors are familiar with net
income, so it’s important for investors
to know why we add back certain figures to a company’s net income to arrive at EBITDA. Before we discuss the
rationale for adding back certain numbers
to a company’s net income, let’s review how to calculate EBITDA.
 Click here to get four prior bond pick updates.
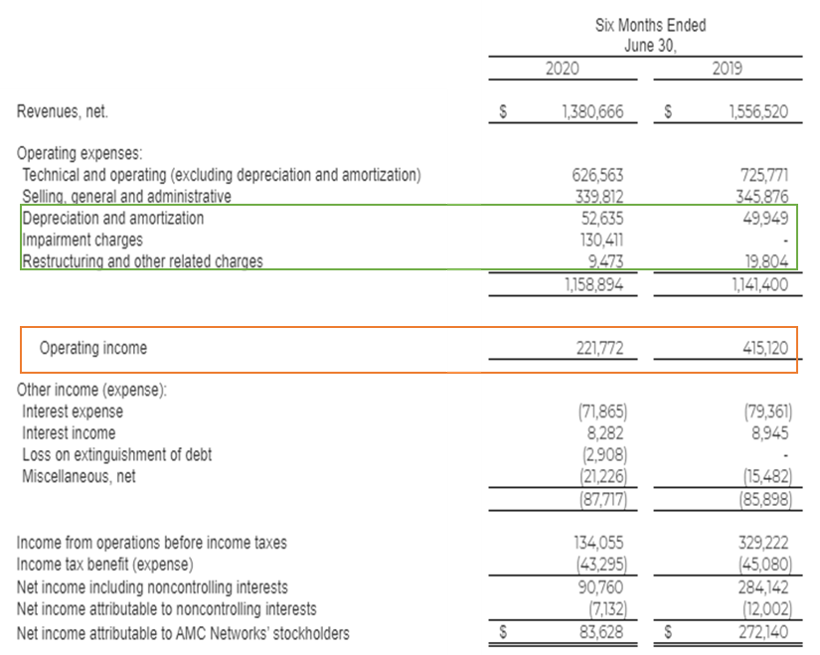
In Figure 2, we show the income statement of AMC Networks (Nasdaq: AMCX), a company that produces and distributes
cable TV and over-the-top (OTT) programming.
We found this information in AMC Networks’ 10-Q, which it filed with the US Securities and Exchange Commission
("SEC") on August 5, 2020 after the completion
of the company’s second quarter of 2020. You can find a company’s SEC filings by Googling the company’s name
followed by “IR” or “investor relations.”
This search should return a URL for the company’s investor relations webpage, which is where you can locate all SEC
filings.
As shown in Figure 2, when companies report earnings, they show the current reporting period beside the comparable
year-earlier period so investors can
compare how the company is performing relative to the prior year.
Figure 2: AMC Networks Income Statement (in thousands)
Source: AMC Networks Form 10-Q filed August 5, 2020
The EBITDA calculation begins with operating income (boxed in orange), which tells investors the profitability
of the company purely from its operations.
If we were calculating net income, as shown in Figure 2, we would deduct interest expense, taxes, etc. from
operating income.
You’ll see, boxed in green, three of the line items that are deducted from revenues to calculate operating
income:
1) Depreciation and amortization;
2) Impairment charges; and
3) Restructuring and other related charges
Operating income is a financial performance metric under generally accepted accounting principles, or GAAP. Over
time, however, non-GAAP measures,
such as EBITDA, have gained popularity, as they provide investors with additional information that can be more
relevant to those assessing a company’s
ability to service its debt. We need to know the cash flow available to service debt, which is why we add back
non-cash items. We also
add back non-recurring items such as restructuring expense, as we want our EBITDA figures to represent a 'steady
state' of the business. We show
the EBITDA calculation for AMC Networks in Figure 3:
Figure 3: AMC Networks EBITDA Calculation for Six Months Ending June 30, 2020
$ in thousands

In Figure 2, AMC Networks split out depreciation, amortization, impairment, and restructuring charges in its income
statement. Stock-based compensation
was included in “Selling, general and administrative;” however, it was not split out on the income statement. We had
to find that number in AMC
Networks’ cash flow statement, which was also disclosed in AMC's 10-Q. Many companies won’t split out depreciation
and amortization on the income
statement; however, these figures can always be found on the cash flow statement.
As noted above, we typically will add back non-recurring restructuring charges; however, there are many companies
that are serial restructurers.
In this case, we would typically not add back restructuring charges since, for these companies, such
expenses are recurring in nature.
Reason 2: Understanding a bond issuer's debt covenant compliance cushion
Corporate bond issuers must comply
with debt covenants, which are limitations
placed on a bond issuer designed to protect bondholders. Debt covenants may limit the amount of stock dividends a
corporate bond issuer can pay and
the amount of stock it can repurchase. Debt covenants can also limit a company’s ability to sell assets and to incur
debt above certain levels.
Companies with bond ratings of Baa3 / BBB- and
above (investment grade)
generally have fewer debt covenants with which to comply than high yield bond issuers. The reason for this
is that corporate bonds rated
below investment grade are deemed to have a higher risk of default in the opinion of bond rating agencies.
Therefore, the bondholders require an
extra level of security to guard against the issuer not being able to satisfy its debt obligations.
A key covenant for many corporate bond issuers is the leverage ratio. The leverage ratio formula shown in Figure 1 is
very similar to the leverage ratio
formula used to calculate debt covenant compliance. For bond issuers with a leverage ratio covenant, every quarter,
they will have to calculate the leverage
ratio and certify that the leverage ratio does not exceed the debt covenant limit.
 Click here to get four prior bond pick updates.
Interestingly, during the COVID-19 crisis, a number of corporate bond issuers were saved by the fact that they issued
company bonds when they were still
rated investment grade, and their debt covenants did not require them to maintain leverage ratios below a certain
level. Many companies, including
large retailers, had negative EBITDA during the first half of 2020, which caused their leverage ratios to skyrocket.
For example, Nordstrom, which
was rated Baa1 / BBB+ before COVID-19, saw its leverage ratio increase from 1.9x on August 3, 2019 to 57.3x on
August 1, 2020. Had Nordstrom's bond
rating been below investment grade prior to the onset of COVID-19, it likely would have had to comply with a
leverage ratio debt covenant, which it would
have violated in 2020.
In certain cases, bond issuers can renegotiate debt covenants with their lenders. Figure 4 shows the leverage ratio
covenant limits for Tupperware
Brands Corporation. Like many retailers, Tupperware was hard hit by COVID-19. As a result, it needed to amend its
debt covenant package with
its lenders, as the company may have breached its previous set of debt covenants.
As shown in Figure 4, the leverage ratio steps down, or decreases, over time, as Tupperware is expected to improve
operations as COVID-19 hopefully subsides
and business returns to normal. On each date specified in Figure 4, Tupperware will need to report a consolidated
leverage ratio that is no greater
than the limit show in Figure 4. For example, when the company reports earnings for the quarter ending September 26,
2020, the company’s leverage
ratio may not exceed 5.25x.
Figure 4: Leverage Ratio Covenant Example -- Tupperware*

* Source: Tupperware SEC filings. Covenant as
amended on February 28, 2020.
Should the actual ratio exceed the financial covenant, Tupperware could be in breach of the covenant, which could,
after a cure period, result in an event
of default.
Understanding how leverage ratios compare to a corporate bond issuer’s debt covenants is key to understanding the
risk of a corporate bond investment and
shows why it is so important to calculate leverage ratios as part of our bond investment analysis. It should be
noted that Bondsavvy calculates a
bond issuer’s leverage ratio when we make an initial corporate bond recommendation and each time we update
our recommendation after companies
report quarterly earnings throughout the course of the year.
Reason 3: Compare ‘like for like’ metrics
When investors assess the value of publicly traded stocks, they
examine P/E ratios, or price-to-earnings
ratios, to see at which multiple different stocks trade. The lower a company’s P/E ratio means you are paying less
for each dollar of a company’s
earnings and, in some cases, obtaining a better value for the stock. The denominator in a P/E ratio is the company’s
earnings per share, or EPS.
The earnings number is the company’s net income, which is then divided by the company’s shares outstanding to obtain
EPS.
 Click here to get four prior bond pick updates.
The reason net income is used as the earnings yardstick for stocks is that common shareholders get paid
after a company pays its interest expense
and taxes. Stock investors need to look at what earnings are potentially distributable to common shareholders, which
is why common stockholders evaluate
net income and P/E ratios.
Bondholders, on the other hand, are serviced with earnings before interest and taxes are paid. This is why,
from a debt investor's perspective,
we look to EBITDA and not net income. The goal is to compare ‘like for like’ metrics as best as we can, which is why
debt investors focus on EBITDA
and stock investors focus on net income.
Where do we find a company’s debt balance to use in the leverage ratio formula?
Now that we've discussed how to calculate EBITDA, the denominator of the leverage
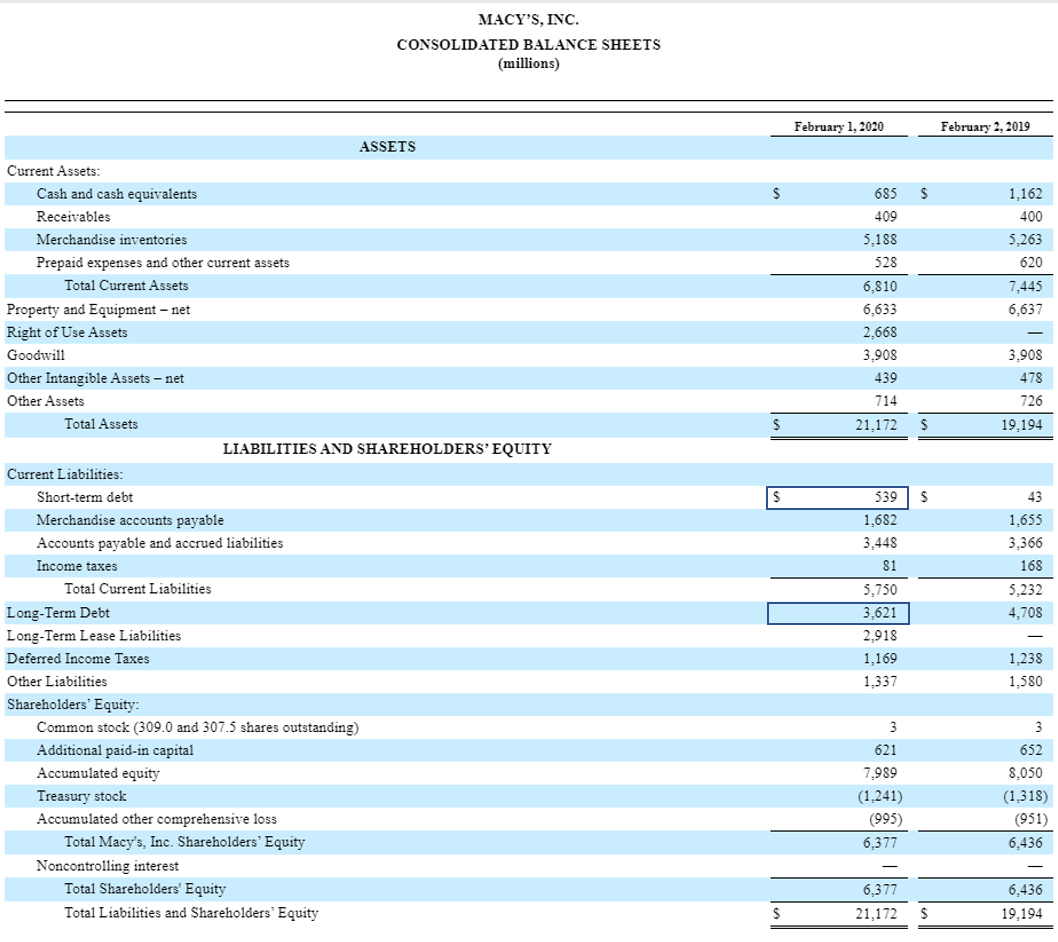
ratio formula, let's now turn our attention to the numerator, total company debt. Figure 5 shows the balance sheet
for retailer Macy’s, Inc., which
the company reported in its 10-K for the fiscal year ending February 1, 2020. Companies will typically break out
debt in two line items on their
balance sheets: short-term debt and long-term debt. Short-term debt is a current liability and reflects debt that is
due within the next year from
the balance sheet date. Long-term debt is any debt that’s not classified as short-term debt.
Figure 5: Macy’s Balance Sheet
Source: Macy’s 10-K filed March 30, 2020.
The debt figures presented in the Macy’s 10-K (boxed above) are big numbers: $539 million of short-term debt and
$3,621 million of long-term debt. These
figures typically include certain accounting adjustments, which we will normalize so our leverage ratio calculations
reflect the company’s total debt.
Fortunately, most companies provide additional detail on what type of debt (senior bank debt, unsecured bonds,
convertible bonds, etc.) makes up the short-term
debt and long-term debt disclosed on their balance sheets. The various pieces of debt, along with other capital
raised by a company, constitute a company’s
‘capital structure.’
Investment Considerations Beyond Leverage Ratios: Capital Structure
While corporate bondholders are senior to stockholders, they are junior to senior debtholders. When one investor is
‘senior’ to another, the senior investor
has priority to claims made on the company in the event of a restructuring or Chapter 11 filing. To the benefit of
bondholders, on February 1, 2020,
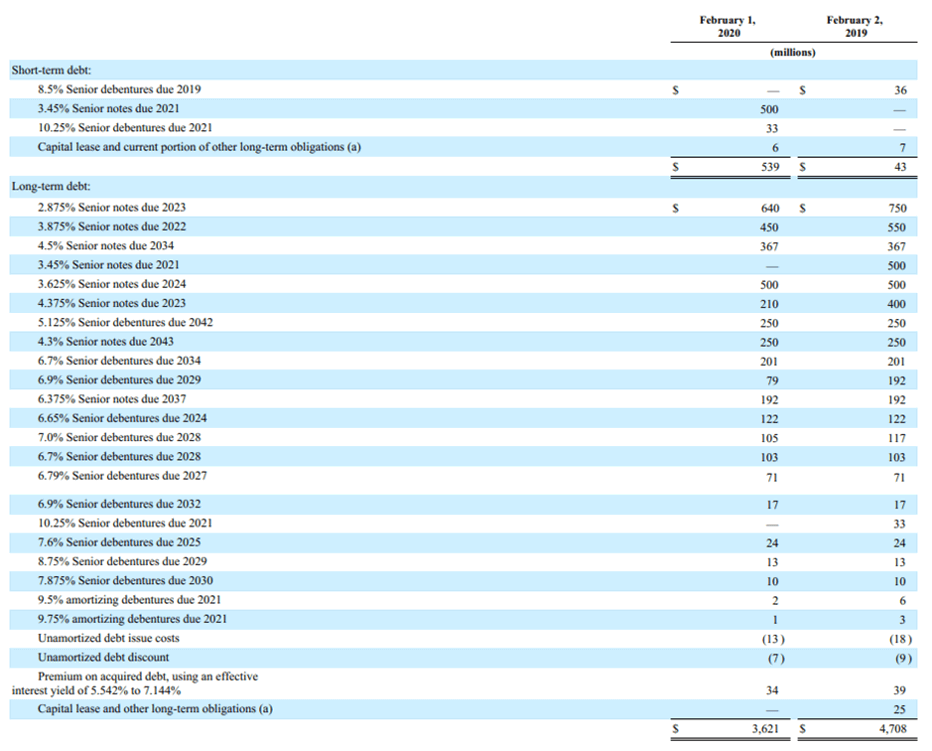
Macy’s did not have any debt senior to its bonds, as shown in Figure 6. Senior notes and senior debentures are both
bonds and they are pari passu, which
means that both securities have the same level of seniority within the Macy’s capital structure.
Many corporate bond investors, following conventional wisdom, favor shorter-term bonds vs. longer-term bonds;
however, in the event of a bankruptcy, all
bonds with the same level of seniority are deemed pari passu. As a result, if a company went bankrupt on
January 1, 2021, bonds due in 2029
and 2042 would obtain the same level of recovery. Therefore, if investors can stomach the higher level of volatility
associated with longer-term
corporate bonds, they can often achieve materially higher returns and have the same near-term default risk as
shorter-term bondholders. Some of our
recommendations with the highest investment
returns have been
long-term investment-grade corporate bonds.
Figure 6 shows Macy’s corporate debt schedule as of February 1, 2020. On this date, Macy’s was in reasonably good
health. As shown below, Macy’s reduced
its debt from $4.7 billion on February 2, 2019 to $3.6 billion on February 1, 2020. In addition, as previously
noted, there was no debt senior to its bonds.
On February 1, 2020, Macy’s leverage ratio stood at a rock-solid 1.5x.
Figure 6: Macy’s Debt Schedule as of February 1, 2020
Source: Macy's 10-K for year ending Feb 1, 2020
Then, COVID-19 hit, and Macy’s had to close its stores and sales plunged. Macy’s drew down $1.5 billion on its senior
credit facility and, due to
COVID-19, its last twelve months’ EBITDA fell from $2.34 billion on February 1, 2020 to $1.2 billion on May 2, 2020.
Together, these factors caused
Macy’s leverage to increase to a high 4.7x. We show the February 1 and May 2, 2020 leverage ratios for Macy’s in
Figure 7:
Figure 7: Macy’s Leverage Ratio – February 1, 2020 vs. May 2, 2020 ($ in millions)

The situation at Macy's shows us why monitoring corporate bond investments, a key part of our bond newsletter subscription,
is so important. In the wake of COVID-19, companies' fortunes changed in an instant. While most companies were able
to raise additional capital
and live to fight another day, many companies lost their pristine pre-COVID balance sheets. This could have
long-term implications for such companies
depending on how quickly they are able to turn around their businesses.
How We Apply Leverage Ratios to Investment Analysis
When we recommend corporate bonds to Bondsavvy subscribers, with few exceptions, we have generally
stayed with corporate bond issuers that have leverage ratios less than 4.00-4.25x and, ideally, less than 3.5x. The
challenge with bond issuers
that have high leverage ratios of 5x and higher is that, in the event of a significant business downturn, the
company’s leverage ratio could easily rise
to 7x or 8x, a level of debt that is often unsustainable, unless the company is anticipating strong future growth.
 Click here to get four prior bond pick updates.
Our corporate bond recommendations are always at the bond, or CUSIP, level. That said, regardless of how many bonds
a company issues, that issuer
will only have one consolidated balance sheet and income statement. Therefore, all of the leverage ratios we
calculate are at the corporate bond
issuer level. Figure 8 shows the leverage ratios, cash, debt, and bond ratings as of the dates we recommended a
specific individual bond of the indicated
issuers. As noted above, we generally look for bonds with low leverage ratios. While Albertsons' leverage ratio was
4.3x when we initially
recommended the Albertsons '29 bond on September 26, 2017, the company's leverage ratio was less than 3x on June 20,
2020, as the company has been paying
down debt and increasing EBITDA. You'll see our other sample bond recommendations were all 2.5x and lower.
Figure 8: Leverage Ratio Examples

Source: Company SEC filings and earnings releases.
(1) As reported for the most recent financial reporting period prior to the Pick
Date.
This article began by saying that leverage ratios enable investors to determine the relative value of potential
corporate bond investments. Figure
8 shows the range of leverage ratios of select bond issuers whose bonds we previously recommended. We can evaluate a
corporate bond's relative value
by comparing a bond issuer's leverage ratio to corporate bond credit spreads,
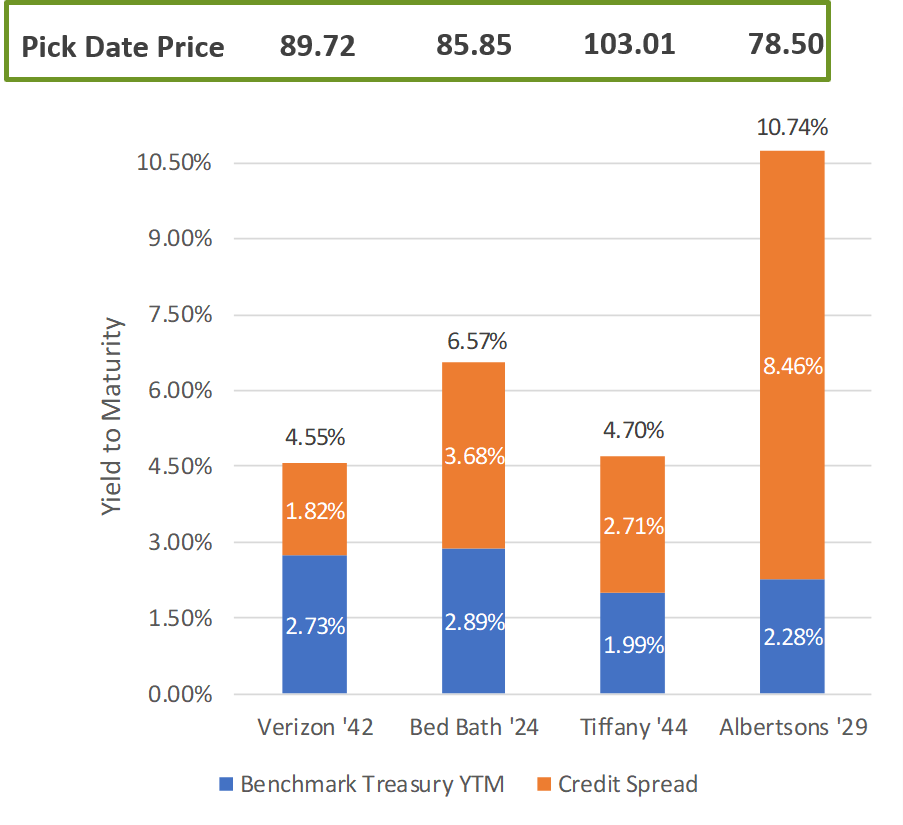
yields to maturity, and prices. When we made each of the above recommendations, the corporate bonds shown below in
Figure 9 all represented compelling
relative values to other bonds in the corporate bond market.
For example, while Albertsons' 4.3x leverage ratio was higher than the other three bonds we recommended, the
Albertsons '29 bonds (CUSIP 013104AF1)
had a 10.74% YTM and an 8.46% credit spread at the time we recommended the bonds. In addition, the Albertsons bonds
had fallen well below par value to
78.50 in the wake of Amazon purchasing Whole Foods and Albertsons suspending its IPO. The high YTMs and credit
spread coupled with the low price
and reasonable leverage ratio made the Albertsons '29 bonds a compelling relative value and a good buy.
We believed the Verizon bonds '42 (CUSIP 92343VBG8), Bed Bath bonds '24 (CUSIP 075896AA8), and Tiffany '44 bonds
(CUSIP 886546AD2) also represented compelling
relative values. In the case of Tiffany, the company had a low leverage ratio of 1.0x, and there was a compelling
4.70% YTM on the Tiffany bonds
due 2044. The yield was relatively high due to Tiffany's business being mostly flat. We were fortunate that, two
months after making this recommendation,
LVMH announced an offer to acquire Tiffany, which caused the bonds to increase significantly in value. We sold the
bonds 4 1/2 months later at a
26% total return, as we discuss in our Tiffany bonds blog post.
Figure 9: Overlaying Leverage Ratios with Credit Spreads, Bond Prices, and YTMs
How Leverage Ratios Can Be More Important Than Bond Ratings
At the beginning of this article, we discussed the primary investment considerations that constitute
Bondsavvy's fixed income
analysis. We consider these factors together when evaluating the potential risk and return of new
investments. We believe this financial analysis is a step above corporate bond ratings, as the latter only
contemplate a corporate bond’s default risk, and even that they don’t do particularly well.
Corporate bond ratings do not speak to the
investment rationale of
a corporate bond since they ignore a bond’s price, yield to maturity, yield to worst, interest rate sensitivity, and
maturity date.
Further, their evaluation of credit risk often misses the mark due to flawed bond
ratings methodologies.
While investors can’t be one-trick ponies and only look at leverage ratios, leverage ratios alone can be a better
gauge of default risk than bond ratings.
The reason for this is that, for corporate bond ratings, basic credit metrics such as leverage ratios and interest
coverage ratios often receive very small
weightings as part of the overall bond ratings methodology, as we show in our below examples.
Moody's and S&P, the two leading bond rating agencies, weigh different factors to arrive at their corporate bond
ratings. These weightings vary
by industry group and include factors such as a company's size, competitive position, revenue and market
diversification, credit ratios, and financial
policy.
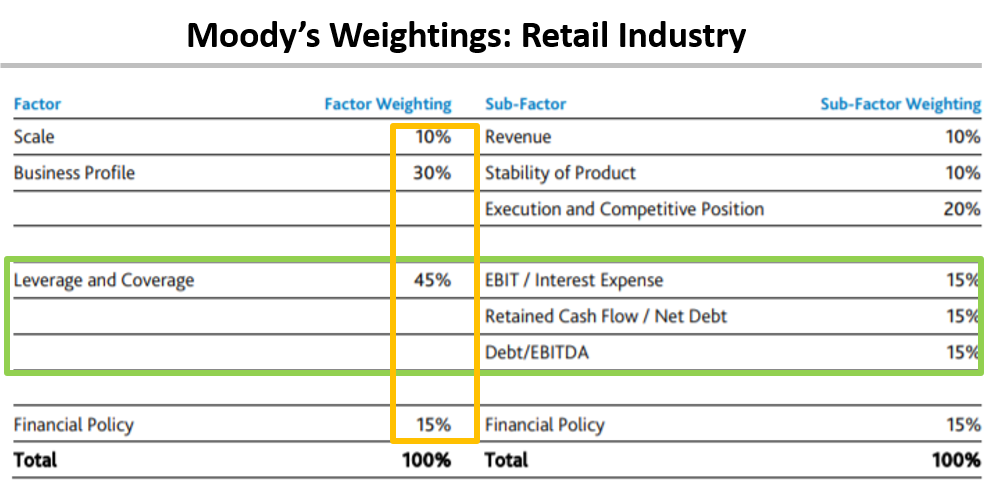
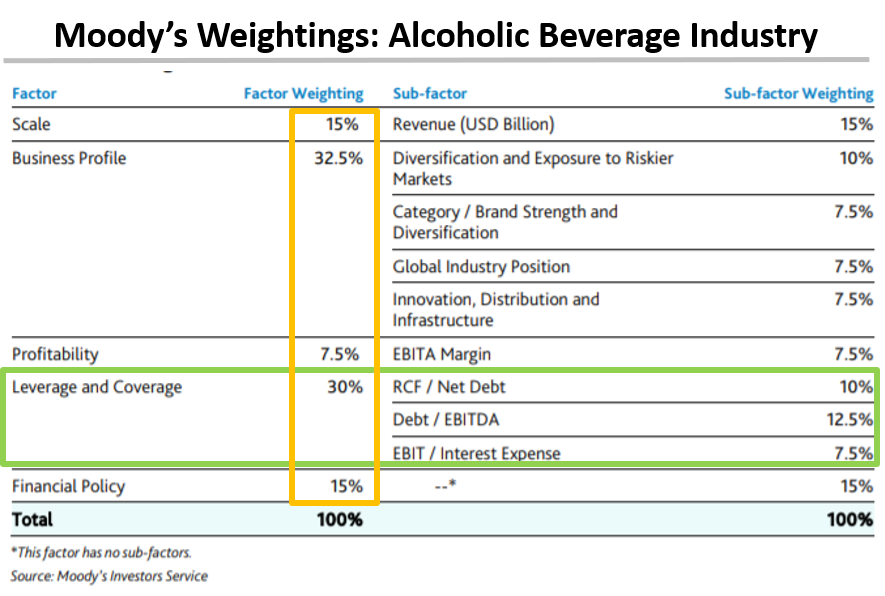
Figure 10 shows the bond rating weightings for the retail and alcoholic beverage industries. For retail, we believe
the weightings make general sense,
as leverage and coverage ratios account for 45% of the rating, with financial policy (i.e., how a company allocates
capital) accounting for 15%.
Size, product stability, execution, and competitive position account for the remaining 40% of the bond rating.
Alcoholic beverages, on the other hand, have weightings skewed toward fuzzy metrics such as innovation and
diversification. Leverage and coverage
ratios only account for 30% of the overall bond rating calculation. Therefore, you could have a bond issuer that has
a high leverage ratio of 5x,
but, if it has lot of revenue and is in many global markets, these more heavily weighted metrics win the day. While
we don't believe leverage ratios
can be the only factor investors evaluate, it doesn't matter how well diversified a company is or how much revenue
it has if it has too much debt relative
to earnings. This is why we believe, in many cases, a company's leverage ratio can be more important than the
company's bond rating.
Figure 10: Bond Rating Weightings for Retail and Alcoholic Beverage Industries
Many self-directed investors and financial advisors will assess the risk/reward of a corporate bond by comparing
corporate bond ratings to the YTMs and
prices of various bonds. The problem with this approach is that it assumes the Moody’s and S&P bond ratings
accurately reflect a bond’s credit
risk, or risk of default. We have shown above how bond rating methodologies vary across industries and can penalize
certain companies if they aren’t
big and well-diversified behemoths. Within the world of bond ratings, there is an underlying bias against companies
that are smaller in size and
generate most of their business in one country, even if that country is the United States.
Comparing Leverage Ratios of Bonds with Similar Bond Ratings
Many bond market gurus and media talking heads address the BBB corporate bond market
as if every corporate bond rated BBB is on the verge of being downgraded, or worse, defaulting. It’s doubtful these
people have spent much time reading
the SEC filings of bond issuers to evaluate the default risk of an issuer. Instead, they blindly rely on the bond
rating agencies to do the work
for them. Figure 11 shows us why this is a bad idea.
Kroger, a leading US grocery chain, and Anheuser-Busch InBev (“AB InBev”), a global alcoholic beverage company, have
nearly identical bond ratings as
shown in Figure 11. On June 15, 2020, Kroger was rated Baa1 / BBB and AB InBev was rated Baa1 / BBB+. This is where
the similarities end.
Kroger has a rock-solid 2.1x leverage ratio compared to 5.1x for AB InBev, which is more typical of a B-rated
corporate bond issuer. We believe Kroger
is slightly underrated at BBB, as its financials are stronger than certain A-rated bond issuers, and COVID-19 has
been a tailwind that has accelerated
growth and positioned Kroger and similar companies well for the future.
Figure 11: Kroger vs. AB InBev -- Similar Bond Ratings but Vastly Different Leverage Ratios*

* AB InBev balance sheet data are as of 12/31/19 while its income statement figures are
through 3/31/20. Kroger’s financials are for the period ending 5/23/20
AB InBev’s business has been hurt by the shutdowns of bars and restaurants across the world. As a result, the
company’s Q1 2020 revenues and EBITDA
fell 10% and 17.7%, respectively. The reason it has kept its undeserved investment-grade rating is due to the bond
ratings methodology shown in Figure
10, which weighs a company’s business profile and scale more heavily than it weighs interest coverage and leverage
ratios. In the end, while business
diversification is nice, a company with a 5.1x leverage ratio is on the verge of serious trouble if its earnings
aren’t growing. It doesn't matter
how well diversified a company's business is if it is has too much debt and its earnings are shrinking.
 Click here to get four prior bond pick updates.
Kroger has a far lower leverage ratio than AB InBev, and its business has been strongly growing. AB InBev has high
leverage and a declining business.
How Moody’s and S&P justify AB InBev's IGINO rating (“Investment Grade in Name Only”) is a head scratcher to us.
Conclusion
Comparing bond issuer leverage ratios to the credit spreads, YTMs, and prices of an issuing company's bonds enables
investors to assess the relative value
of potential corporate bond investments. As discussed earlier, while leverage ratios are important, they are one of
many factors Bondsavvy's fixed income research considers
prior to making new bond recommendations to our bond newsletter subscribers.
Our goal with educating investors about leverage ratios is that this metric becomes as widely used and understood by
bond investors as P/E ratios are by
stock investors. With this, we will increase investors' comfort with individual corporate bonds and empower more
investors to benefit from the income, potential capital appreciation, and relative safety individual corporate bonds can provide.
Get Started
Watch Free Sample