Many investors believe that the Federal Reserve pulls all the strings in the US corporate bond market, causing bond prices to rise and fall at its whim. While the Fed can have a big influence, corporate bond investors must understand the true drivers of corporate bond prices and yields to make successful investments.
This fixed income education article discusses the two building blocks of a corporate bond's yield to maturity and how movements in both can impact investment grade and high yield corporate bonds in different ways.
- What credit spreads are
- A comparison of corporate bond credit spreads in April 2020 vs. October 2023
- What makes credit spreads tighten and widen
- How credit spreads and US Treasury yields cause movements in US corporate bond prices
- Investment grade bond credit spreads vs. high yield bond credit spreads
- How to read the Wall Street Journal bond tables
What Is a Credit Spread for Corporate Bonds?
Credit spreads, also known as Treasury spreads, are the difference between a corporate bond's yield to maturity ("YTM") and the YTM of a US Treasury bond
or note with a similar maturity date (the 'benchmark Treasury'). The credit spread represents the extra compensation, or yield, a corporate bondholder
receives above the so-called risk-free rate of the US Treasury bond. (We don't believe a government that runs trillions in red ink is "risk free,"
but that's a discussion for a different day.)
Since corporate bonds are deemed to have a higher default risk than the US government, corporate
bond YTMs are typically higher than Treasury bond YTMs for bonds of similar maturities. The amount of this difference is the credit spread.
As we discuss in this fixed income education article, movements in Treasury bond yields and credit spreads will impact corporate bonds in different ways. Treasury yields
and credit spreads are the building blocks of a corporate bond's YTM. Understanding how their movements impact corporate bond prices is essential
knowledge for all corporate bond investors.
How Credit Spreads Work for Corporate Bonds
The best way to show how credit spreads work is through an example of a corporate bond Bondsavvy previously recommended and subsequently sold after
its bond price increased 25 points. The recommendation was for Tiffany bonds 4.900%
'44 (CUSIP 886546AD2). We recommended the Tiffany '44 bonds on September 5, 2019 at an offer price of 103.01 and a YTM of 4.70%.
In Figure 1, we show the Tiffany bonds' YTM has two components: 1) the benchmark Treasury YTM, shown in blue and 2) the credit spread, shown in orange.
The 'benchmark Treasury YTM' is the YTM of a Treasury bond that has a similar maturity date to the Tiffany bonds' maturity date.
Since the maturity
date of the Tiffany bonds is October 1, 2044, the benchmark Treasury is the US Treasury 3.00% 11/15/44 bond (CUSIP 912810RJ9). The reason the benchmark
Treasury has a similar maturity date to the corporate bond we are evaluating is that we want to isolate what part of the corporate bond's yield is moving
due to movements in US Treasury yields vs.
the portion of the yield that is changing based on the credit-risk component of the bond.
If we selected a Treasury bond with a maturity date in
2025 instead of 2044, there would be differences in the benchmark bonds' maturity dates, which would impact the YTMs of both bonds. By referencing
the corporate bond against a Treasury bond with a similar maturity, we can identify the portion of the YTM that is the credit spread.
On September 5, 2019, the US Treasury '44 bond had a YTM of 1.99%. Since the Tiffany bonds had a YTM of 4.70%, the credit spread was 2.71% or, 271
basis points. For bond newbies, 100 basis points (often shown as 'bps' and pronounced as 'bips' or 'beeps') equals 1 full percentage point.
Fifty bps equals 0.50%.
Figure 1: Corporate Bond Credit Spreads: Tiffany 4.900% 10/1/44 Bond

Prices and yields sourced from Fidelity.com
Since the credit spread on the Tiffany bonds was 2.71% on September 5, 2019, if we were to hold the Tiffany bonds until the maturity date, we would receive
2.71 percentage points of additional annual return compared to the US Treasury '44 bond. We receive this extra yield since the Tiffany bonds are deemed
to have a higher risk of default than the US Treasury bonds. Bonds with a low -- or "narrow" -- credit spread are generally deemed to have a higher credit
quality and less default risk than bonds with a higher -- or "wider" -- credit spread.
How Credit Spreads and Treasury Yields Impact Corporate Bond Prices
In Figure 1, the YTM of the Tiffany bonds was 4.70% on September 5, 2019. This corporate bond YTM will move up and down based on movements in the credit
spread and the benchmark Treasury yield. Assuming no change in the US benchmark Treasury YTM, if the credit spread increases, the Tiffany bonds' YTM will
increase, which will cause the bond price to fall. Should the credit spread shrink, the bond's YTM will also shrink causing the bond price to increase.
The same dynamic happens if the credit spread goes unchanged and the benchmark Treasury yield increases or decreases.
The reason why the Tiffany bonds increased in price from 103.10 to 128.00 over the course of 4 1/2 months is there was a sharp decline in the Tiffany bonds'
credit spread. This credit spread decline was driven, in large part, by LVMH and Tiffany entering into an agreement on November 25, 2019 where LVMH was
going to acquire Tiffany.
Many investors believed the combined LVMH-Tiffany would be of a higher credit quality than Tiffany standalone and, on November
26, 2019, S&P put Tiffany's bond ratings on 'CreditWatch Positive,'
since Tiffany (rated BBB+ by S&P) was being acquired by a higher-rated entity in LVMH, which was rated A+. LVMH would assume the Tiffany debt
as part of the transaction and, generally speaking, when a higher-credit-quality company acquires a lower-credit-quality company, the bonds of the lower-rated
company should move up in ratings to match the acquiring company's bond ratings, provided the acquisition doesn't materially worsen the acquiring company's
credit profile.
As the Tiffany bonds' credit spread fell from 2.71% to 0.96%, the bonds' YTM fell to 3.20% and the bond price increased to 128.00. At the time, this
credit spread was in spitting distance of certain Apple bonds. Since Apple had a superior credit quality to Tiffany (Apple's $200+ billion in cash, at the time, had a big impact on this), we didn't believe the Tiffany bonds' credit spread could fall much further. As a result, we decided to sell the Tiffany
bonds at 128.00 and achieve a 26% total return vs. a 2.03% return for the iShares investment grade corporate bond ETF, iShares LQD.
Please read the full blog post of our Tiffany bonds investment and view our investment returns from
our current and previous corporate bond recommendations.
While the Tiffany bonds' credit spread shrunk significantly, the benchmark Treasury bond YTM increased 0.25 percentage points. This was a moot point,
however, since the credit spread decreased by such a larger amount than the Treasury bond YTM increased, which is why the bond price increased 25 points.
Many investors might be surprised that a corporate bond's price could increase 25 points over the course of four and one-half months. The reason
this could happen is that the Tiffany bonds weren't due until 2044 and bonds with a longer time to maturity can be far more volatile than corporate bonds
that mature in the near term.
This can also work in the investor's disadvantage, as a long-term corporate bond can also fall significantly in price. For example, in the midst
of the COVID-19 crisis, the Apple 4.650% 2/23/46 bond (CUSIP 037833BX7) fell from 140.00 to 104.00 over the course of several days due to redemption-fueled
forced selling by bond funds.
A shorter-term Apple bond, Apple 3.45% 5/6/24 (CUSIP 037833AS9), only fell eight points, from 108 to par.
Given Apple's strong credit quality and the market boost engineered by the US Treasury and Federal Reserve, by mid-2020, both bonds were trading at levels
similar to where they traded before the COVID-19 US outbreak.
Many investors elect to stay away from long-dated bonds during periods of rising interest rates; however, in our How To Profit from Rising Interest Rates blog
post, we show investors how buying such long-dated investment grade corporate bonds can generate high long-term returns with low credit risk. Investors can achieve such long-term returns provided they can stomach generally higher price volatility than short-term bonds.
Ranges of Corporate Bond Credit Spreads
When Bondsavvy makes corporate bond recommendations, we compare the credit spreads of various corporate bonds to the financials of each bond issuer.
This helps us assess whether a particular bond is a better value than another.
The flawed bond ratings methodologies of Moody's and S&P create many opportunities where bonds are misrated
and, as a result, certain corporate bond credit spreads can be inflated relative to their issuing company's financials. This can create bargains
for 'bond-savvy' investors.
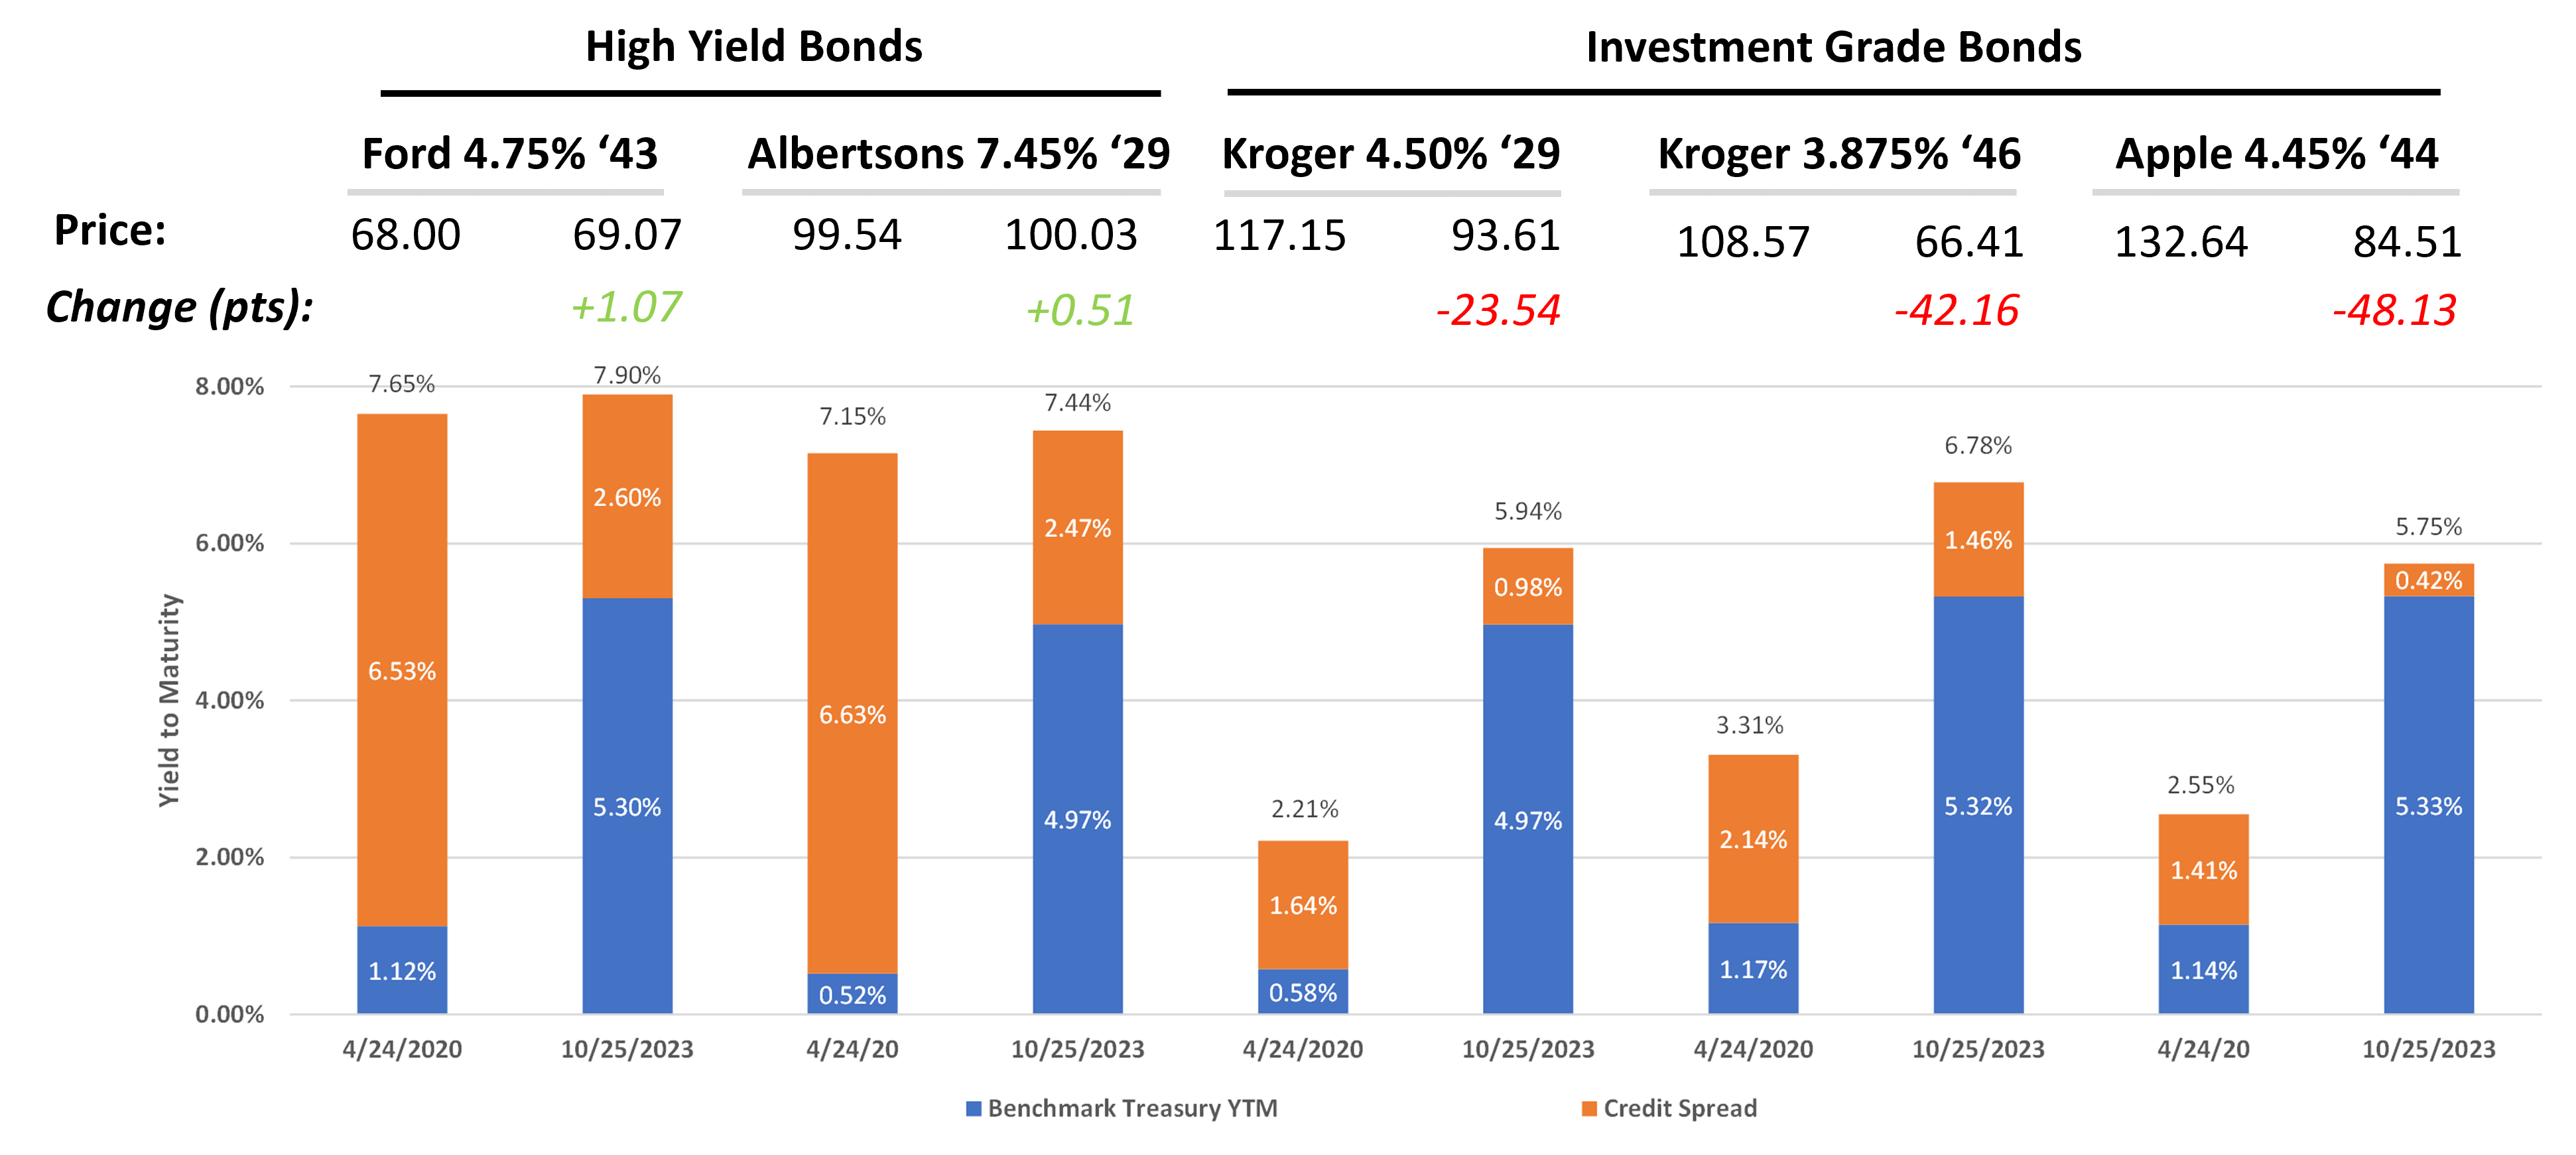
Figure 2 shows a range of credit spreads and the benchmark Treasury bond YTM for five corporate bonds, including two high yield bonds and three investment grade bonds. We show these credit spreads on two dates: April 24, 2020 and October 25, 2023.
The sample high yield bonds include:
1) Ford Motor 4.75% '43 (CUSIP 345370CQ1)
2) Albertsons 7.45% '29 (CUSIP 013104AF1)
The sample investment grade bonds include:
1) Kroger 4.50% '29 (CUSIP 501044DL2)
2) Kroger 3.875% '46 (CUSIP 501044DF5)
3) Apple 4.45% '44 (CUSIP 037833AT7)
The reason we show Figure 2 is so bond investors can see the range of corporate bond credit spreads, as well as the building blocks of corporate bond YTMs. When we first created this chart in April 2020, Apple had the highest
credit quality of all of the bond issuers shown and, as a result, the Apple bonds 4.45% '44 had the lowest credit spread. Kroger is also a very strong credit, but it's not as strong as Apple.
We compare the components of each corporate bond's YTM on April 24, 2020 and October 25, 2023 so that investors can see the impact of the Federal Reserve's historic interest rate hikes in 2022-2023.
Corporate bond credit spreads on April 24, 2020
We originally drafted this corporate bond credit spreads article on April 24, 2020, shortly after the onset of Covid-19 in the United States. Ford had been negatively impacted by the COVID-19 crisis, and the Ford bond '43 credit spread had increased from 3.04%
on January 22, 2020 to 6.53% on April 24, 2020. As a result of this increase, on April 24, 2020, the credit spread made up 85% of the Ford '43 bond's YTM.
The other dynamic this chart shows is how the maturity date of a bond impacts a corporate bond credit spread. While, on April 24, 2020, the Apple '44 bond had a credit
spread 73 basis points (or 0.73 percentage points) narrower than the Kroger '46 bond, it's only 23 basis points narrower than the Kroger '29 bond.
The reason for this is that credit spreads are generally tighter for shorter-dated investment grade bonds since there is a lower risk of default over the near term
than there is, in say, 25 years.
In some cases, short term investment grade corporate bonds can have negative credit spreads. These are investment opportunities from which we typically stay away.
Figure 2 compares the credit spreads, bond prices, and YTMs of our five select corporate bonds on April 24, 2020 to October 25, 2023. As the US federal reserve increased the fed funds target rate from 0.00%-0.25% to 5.25%-5.50% between March 2022 to mid-2023, the benchmark Treasury YTM has surged for all of the five bonds. To mollify this impact, credit spreads of all five bonds fell from 2020 to 2023. This included the credit spreads of the Ford '43 and Albertsons '29 bonds, which fell 393bps and 417bps, respectively.
Figure 2: Corporate Bond Credit Spreads and YTMs - April 24, 2020 vs. October 25, 2023
Source: Fidelity.com
How Corporate Bond Yields and Credit Spreads Changed from 2020 to 2023
There is a significant difference between the high yield bond yields and investment grade bond yields shown in Figure 2. From April 24, 2020 to October 25, 2023, the Ford '43 and Albertsons '29 bond yields held steady, with both YTMs increasing slightly. Their prices also slightly increased, as October 2023 was 3.5 years closer to the maturity of the Ford and Albertsons bonds.
This pricing stability occurred during one of the worst bond market collapses of all time. This was able to happen due to the high Ford and Albertsons credit spreads on April 24, 2020. As US Treasury yields surged during 2022, the Ford and Albertsons credit spreads shrunk to limit the amount both bonds' YTM increased.
This is a night-and-day comparison to the three sample investment grade bonds, which registered price declines from 23.54 points (Kroger '29) to 48.13 points (Apple '44). These three investment grade bonds had far "tighter" credit spreads on April 24, 2020. With this being the case, the credit spreads had little room to tighten (or shrink). Therefore, the rising US Treasury yields drove the bus, which caused the YTMs of the three bonds to shoot up and the prices to drastically fall.
A Note on Our Previously Recommended Albertsons 7.45% '29 Bond
The Albertsons '29 bond is a case of a bond that has been forever unloved by bond rating agencies. The company's leverage ratio recently fell below 3x, which is typically good enough to obtain an
investment-grade bond rating. Unfortunately, the bond rating agencies have never gotten it right with Albertsons. Moody's withdrew its bond rating several years ago, and S&P rates it B+. S&P rated the bond CCC+ as late as June
27, 2019 even though Albertsons continued to report strong operating performance and a significantly reduced debt load. Albertsons is a perfect example
of where we found a bond issued by a strong company that was trading with a credit spread far higher than it should be.
We recommended the Albertsons
bonds at a price of 78 on September 26, 2017 and, in late 2020, the bonds were trading between 115.00 and 119.00. After the Albertsons bond price fell between 2020 and 2022, we recommended a sell at 107.45. This generated a total investment return of 79.52% compared to a 15.18% return for the iShares HYG high yield corporate bond ETF.
Investment Grade Bond Credit Spreads
As we show in our bond ratings scale post, bonds rated Baa3 / BBB- and
higher by Moody's and S&P, respectively, are deemed investment-grade corporate bonds. Bond ratings have many weaknesses, such as flawed bond rating methodologies and not factoring in a bond's price, yield, maturity date,
interest-rate risk, liquidity, and relative value. That said, they do have a significant impact on how bonds trade and their level of duration
risk, or how sensitive corporate bonds are to
rising interest rates.
This impact is driven by how corporate bonds are quoted on brokerage and institutional money manager trading desks.
While individual investors will always see bonds quoted on a dollar-price basis (shown in the orange box in Figure 3), when large broker-dealers and money
managers trade large blocks of investment-grade corporate bonds, the bonds are quoted as a credit spread. As shown in Figure 3, the top-of-book bid-offer
quotes on this eBay '42 bond were 3.96% / 3.91% on a YTM basis. As shown in the large blue box below, these corporate bond YTMs imply a credit spread
quote of 2.77% / 2.73% or, if presented in basis points, 277 / 273. These credit spreads will go up and down based on overall market conditions,
as well as how a particular bond issuer is performing financially and if there is any specific news around a bond issuer, such as a large acquisition.
Since investment-grade corporate bonds are quoted as a spread to the benchmark Treasury, the corporate bond YTM will move up and down based on movements
in the credit spread and in the benchmark Treasury bond's YTM. This is why investment-grade bonds can be sensitive to changes in underlying
Treasury yields. In addition, since investment-grade corporate bonds are issued with longer-dated maturities and lower coupons, their duration risk
is typically higher than that of high-yield corporate bonds.
Figure 3: Corporate Bond Price Quotes -- eBay 4.00% 7/15/42 (CUSIP 278642AF0)

Source: Quotes shown on Fidelity.com April 27, 2020
High Yield Bond Credit Spreads
Corporate bonds rated below investment grade (also known as 'high yield bonds') are generally not primarily impacted by falling or rising interest rates. There are two primary reasons for this:
First, while all corporate bond YTMs are composed of the credit spread and the benchmark YTM, for high-yield bonds, the credit spread generally makes up the lion's share of the corporate bond's yield. For example, as shown in Figure 2, the Albertsons 7.45% 8/1/29 bonds had an offer-side YTM of 7.15% and a credit spread of 6.63% on April 24, 2020. The benchmark Treasury YTM was 0.52%, so the credit spread comprised 93% of the bond's YTM. Since the credit spread represented nearly all of the bond's YTM on this date, changes in it would be expected to have a bigger impact on the price of the Albertsons bonds vs. changes in US Treasury yields.
Second, when high-yield
corporate bonds are quoted on a professional trading desk, they are quoted on a dollar-price basis, which represents the percentage of par value at which the bond trades. Throughout the trading day, high yield bond prices will fluctuate based on the financial performance of bond issuers, the level of risk perceived in bond markets, taxable bond fund inflows and outflows, and general market conditions. This is different than investment-grade corporate bonds, which are quoted as a credit spread on professional trading desks. As discussed above, as Treasury YTMs fluctuate, assuming no change in the credit spread, corporate bond YTMs will move in the same direction as benchmark US Treasury YTMs.
How To Read The Wall Street Journal Bond Tables
Our Founder Steve Shaw has presented to over 20 American Association of Individual
Investors (AAII) chapters nationwide. Following one presentation, an attendee asked how to read the corporate debt tables shown in the Wall Street Journal.
After reading this blog post, you will now have a full understanding of why the WSJ corporate debt tables are presented the way they are and how to read
them. Please note that Figures 4 and 5 represent prices from early 2019, when this particular AAII presentation was made.
As shown in Figure 4, the figures under the column "Current" represent the credit spread, in basis points, of each of the corporate bonds in the table.
You'll remember, in Figure 3, the eBay bonds had an offer-side credit spread of 273 basis points. If the eBay bonds were to make it into this table,
that 273 number is what you would see under the "Current" column. If the credit spread shrunk from the preceding day, the bond would appear in the
"Investment-grade spreads that tightened the most..." part of the table. If the credit spread tightened, assuming the benchmark US Treasury bond
YTM didn't change, the price of the bond increased, as the corporate bond's YTM would have decreased. On the other hand, if the credit spread widened,
all else equal, the corporate bond's YTM increased and the bond price fell.
The WSJ presents the table this way since investment-grade corporate bonds are quoted as a spread to their benchmark US Treasury bond or note, as previously
discussed.
Figure 4: Wall Street Journal Corporate Debt Table - Investment Grade Credit Spread Changes

Since high-yield corporate bonds are quoted as a percentage of their face value, or on a 'dollar-price basis,' the WSJ bond tables show high-yield corporate
bonds in the same way. In this table, you'll see the Penn National Gaming bonds due in 2027 had a dollar price of 103.135 and increased in price
0.89 points from the previous trading day.
Figure 5: Wall Street Journal Corporate Debt Table - High-Yield Corporate Bond Price Changes

Conclusion of "What Is a Credit Spread and How Does It Impact Bond Prices?"
The reason we wrote this fixed income education article was to provide bond investors an understanding of why corporate bond prices move and how credit spreads and US Treasury bond
yields impact corporate bonds. Corporate bond investors can use this knowledge when building their bond portfolios.
As shown in Figure 2, many investment grade bonds performed poorly during 2022-2023 due to the sharp rise in US Treasury yields. Between January 2022 and October 2023, Bondsavvy had recommended 30 new corporate bonds, of which 20 were high yield bonds and 10 were investment grade. While capital appreciation has been rare, the newly recommended high yield bonds have generally held their value. In addition, the investment grade bonds we did recommended typically had shorter-dated maturities.
Of course, navigating bond markets isn't just about credit quality and a bond's time to maturity. We also have recommended bonds across 16 different industry groups to mitigate risk and to capitalize on favorable trends occurring in select industries. In addition, our keen focus on our recommended bond issuers' financial performance enables us to spot opportunities most miss when they limit their analysis to comparing a bond's rating to its yield.
Choose My Plan
Watch Free Sample